Continuing my search for a better debugging experience for my current projects (zig/c, nixos).
The first post resulted in a ton of suggestions and I tried them all.
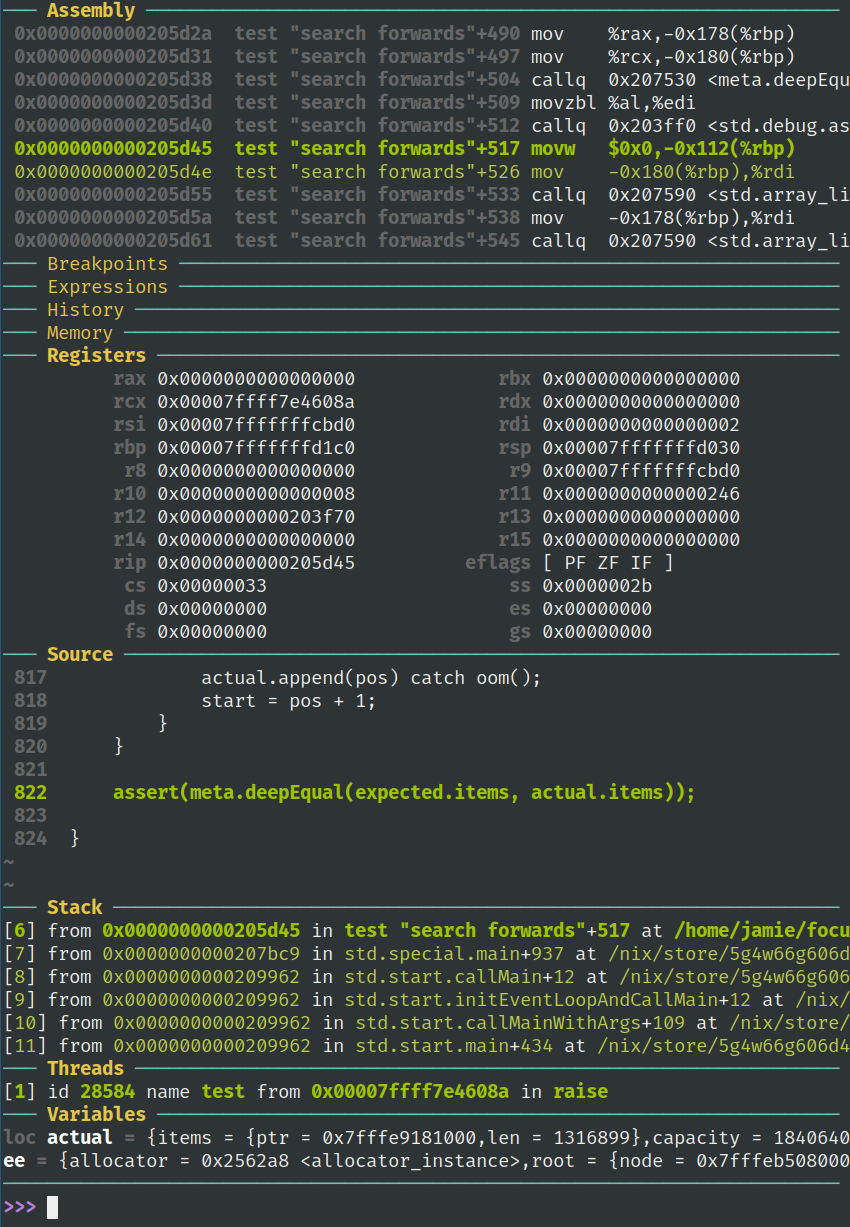
gdb -tui (again)
taviso explained how to use the tui properly.
C-l fixes the display and using gdb -tty $SOME_OTHER_TTY stops it from getting messed up in the first place.
Readline bindings (C-n, C-p etc) work in the command window even while the source window has focus. focus cmd gives focus to the command window so I can use arrow keys again.
C-x A is supposed to toggle the tui but for me just crashes, in both alacritty and xterm. I've reported this against nix for now, since that's the most likely culprit. (EDIT nope, it was a gdb bug).
emacs gdb
Many people suggested using gdb and gdb-many-windows instead of gud.
This is much better - I get a clickable thread list, backtrace and locals list.
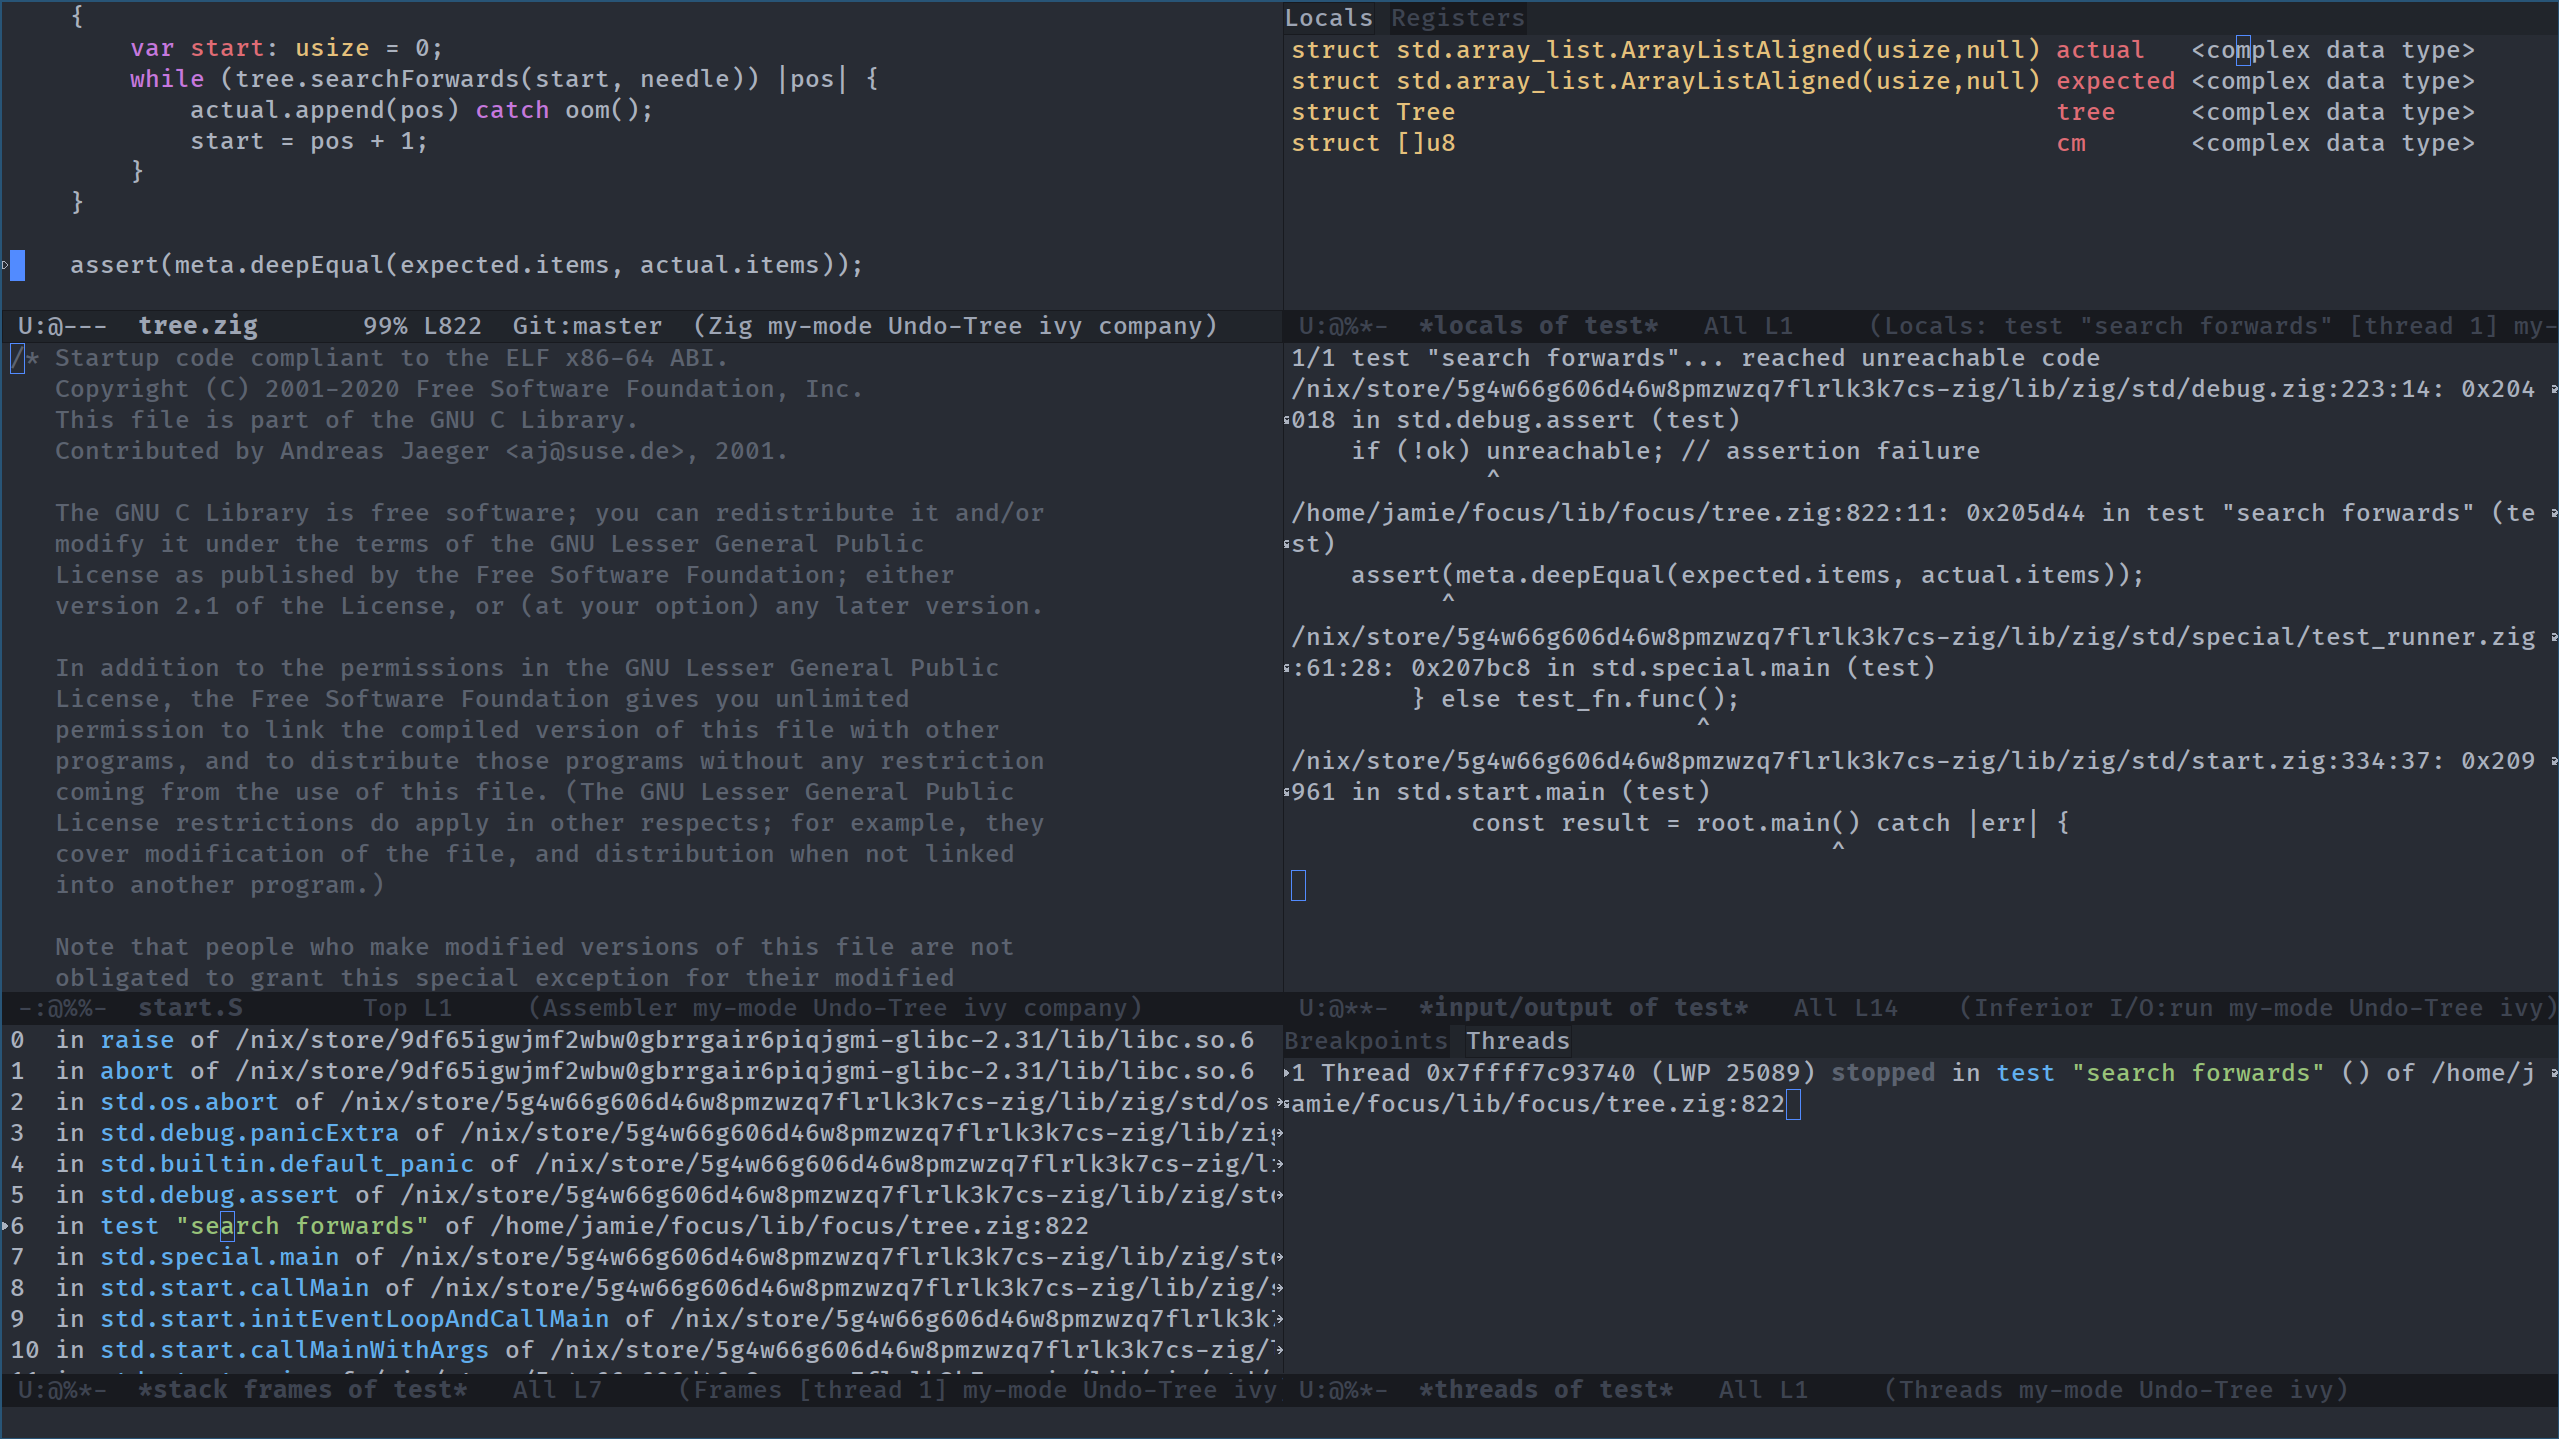
It displays all my locals as "<complex data type>" which is not super helpful. There is a patch to improve this but it looks like it got delayed by legal issues.
emacs dap-mode
For gdb this requires the vscode extension which I couldn't get working in the last post, so I haven't investigated further.
clion (again)
Kaylee Blake emailed me:
Several of the issues you encountered with CLion are ones I have previously encountered, and thankfully two of them are solvable and one can be worked around.
Your variables are (probably) not being displayed because CLion leans on its language support for computing precise start-of-scope for variables (GDB doesn't support this DWARF feature, sadly), but unfortunately defaults to assuming that variables are always out of scope if its language support isn't capable of mapping debug symbols to declarations. (It appears that the Zig plugin doesn't have any debugger integration). As such, you need to click on the gear icon on the left of the debug pane (in your screenshot, hidden behind a
>>symbol at the bottom), and uncheck "Hide out-of-scope variables".
To use the Memory View, you need to right-click on any variable and choose "Show in Memory View", which will actually cause the pane to load. I have no idea why this is required given that the Memory View is perfectly capable of navigating to raw addresses or addresses computed by arbitrary expressions once the pane has loaded.
You (probably) can't set breakpoints through the UI because the Zig plugin doesn't register the Zig filetype as capable of having breakpoints set on it. There's no way to fix this without writing a plugin, unfortunately, but you can still use the GDB console to set breakpoints. They won't persist between sessions, though, or show up in the UI.
Both of the fixes worked. I can now see variables and open them in the memory view.
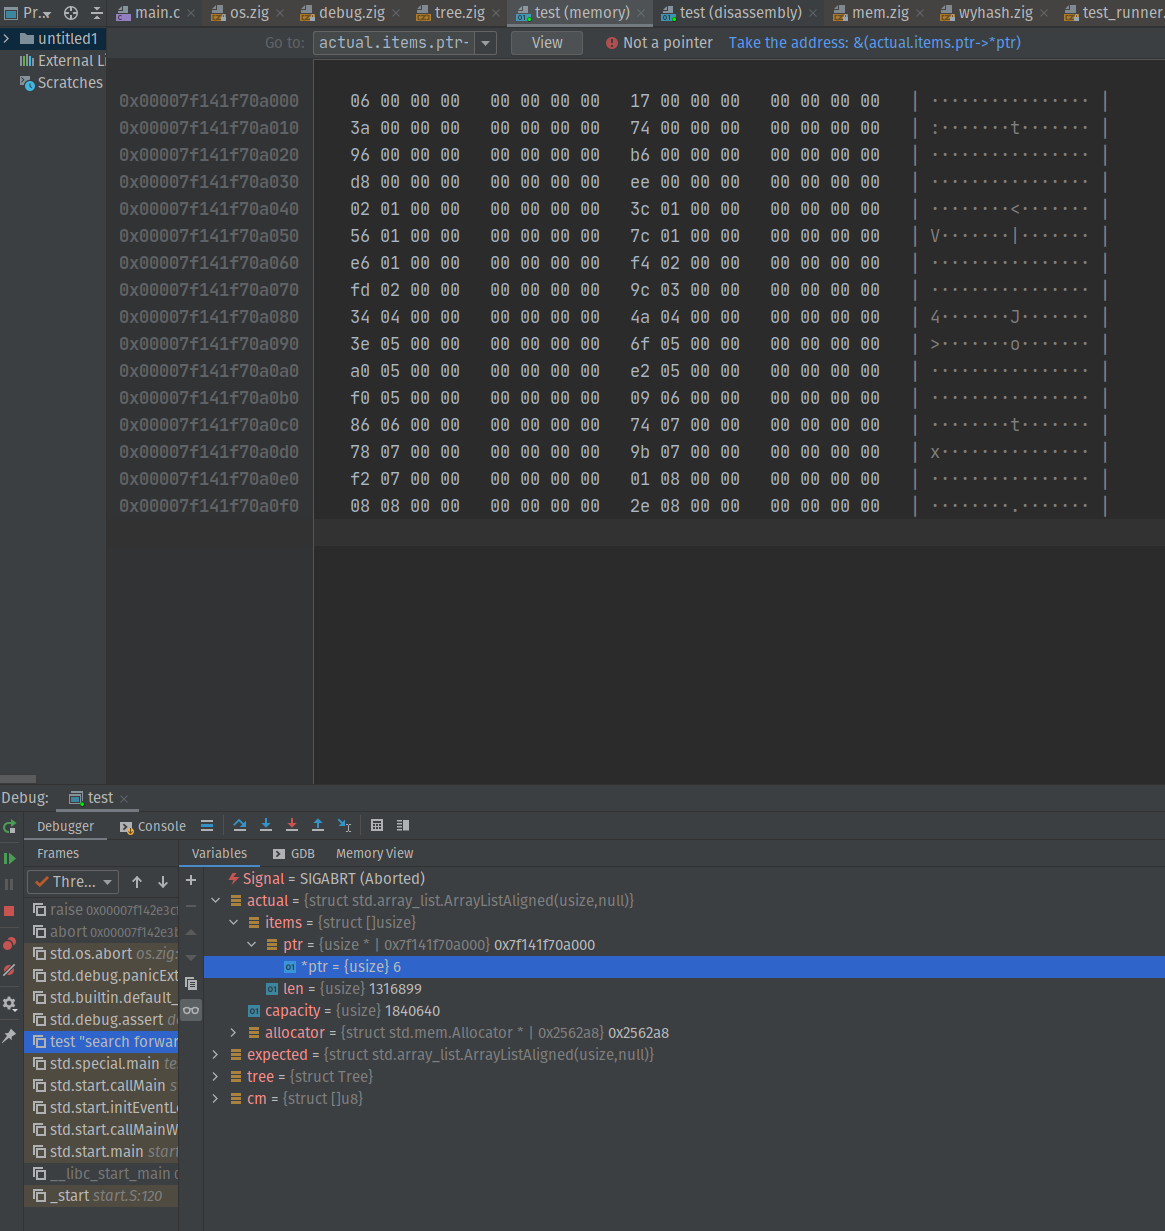
The memory view doesn't support editing memory, but I can still do that in the gdb console.
I added *actual.items.ptr@100 to the watches list and it rendered the whole array perfectly happily.
Setting breakpoints in the gdb console seemed to work at first, but restarting the program to get to the breakpoint doesn't. If I rerun using the button in the debugger, the breakpoints disappear. If I try to restart the program from within gdb, it crashes:
(gdb) info breakpoints
No breakpoints or watchpoints.
(gdb) b Tree.searchForwards
Breakpoint 1 at 0x207222: file /home/jamie/focus/lib/focus/tree.zig, line 591.
(gdb) run
Command 'run' is not supported.
(gdb) start
The program being debugged has been started already.
Start it from the beginning? (y or n) [answered Y; input not from terminal]
Temporary breakpoint 2 at 0x2097dc: file /nix/store/5g4w66g606d46w8pmzwzq7flrlk3k7cs-zig/lib/zig/std/start.zig, line 243.
Starting program: /home/jamie/focus/test 1> '/dev/pts/4' 2> '/dev/pts/5'
During startup program exited with code 1.
I can get this to work by starting the program, immediately pausing, setting a breakpoint and then resuming.
Holding F8 to continue runs smoothly, like most of the other debuggers. But unlike most of the other debuggers the local variables stop being displayed until I release the key, so I can't just watch the changes in real time.
netbeans
I made a new C++ project with the wizard and hit "Debug Main Project". At first I though nothing happened, but after a while I noticed a small red message box at the bottom-right of the screen.
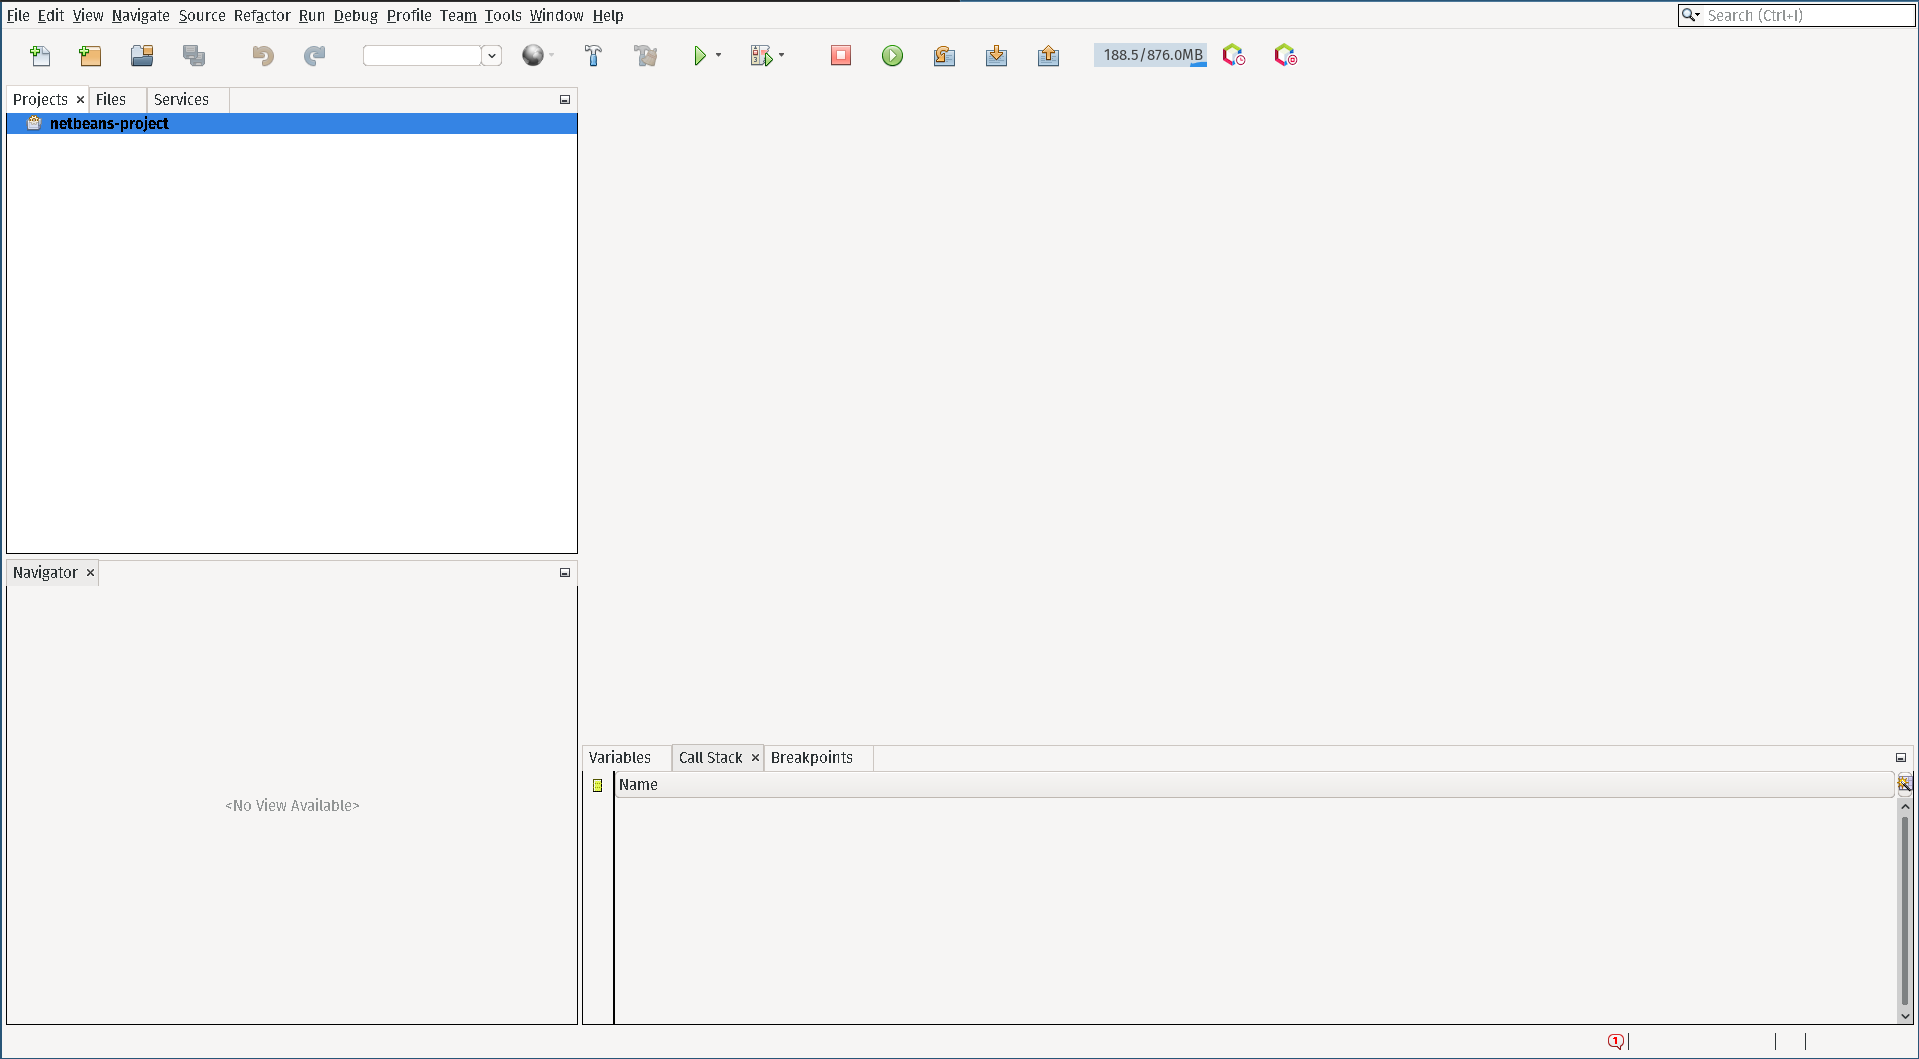
It's actually bigger when it first appears, but it shrinks after a few seconds of not being noticed.
Anyway:
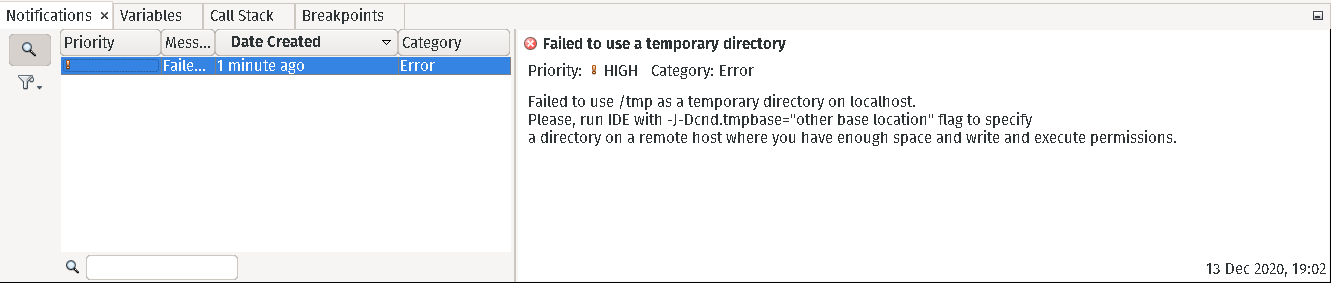
It says it can't write to /tmp.
jamie@machine:~/nixpkgs$ cat > /tmp/test
foo
jamie@machine:~/nixpkgs$ cat /tmp/test
foo
I can write to /tmp.
It also says I should do something like netbeans -J-Dcnd.tmpbase="/home/jamie/netbeans-project". But that produces the same error message, still referring to "/tmp" rather than the directory I gave it. Did I spell something wrong?
Also:
[nix-shell:~]$ strace netbeans 2>&1 | grep 'tmp'

[nix-shell:~]$
It doesn't actually seem to be trying to write "/tmp". It actually doesn't issue any syscalls at all when I press "Debug Main Project" and trigger the message. So I think it's just misreporting some other error. The underlying issue is probably nix-related again.
Also... I try to avoid ranting about software, because software is hard. But if you give me an error message and then make the error text non-selectable and then in the context menu only offer "Mark As Read" instead of "Copy To Clipboard So I Can Google This" then it makes debugging a lot slower.
cgdb
Broadly similar to gdb -tui. It shows the source window and has a lot of useful keyboard shortcuts, but it doesn't display much ambient information like current backtrace or local variables. Everything seems to work, but it's not what I'm looking for.
kdevelop
[nix-shell:~]$ kdevelop --version
kdevelop 5.5.2
Running, breaking, setting watchpoints and navigating the backtrace all worked smoothly.
There doesn't seem to be a memory view or a way to display arbitrary expressions. I tried adding display (*actual.items.ptr)@100 in the gdb console and it didn't appear anywhere on screen, nor did it print the result in the console after the first time.
The rendering of large arrays is a bit annoying - you have to click at the beginning to reveal a few more elements, but they appear at the end. So getting the whole thing on screen requires lots of scrolling.
The key binding for 'next' is also in use by kate, so you have to go into the bindings menu and disambiguate. Which wouldn't be a big deal except that it reset several times over the course of a single session so I had to keep visiting the bindings menu.
gdb-dashboard
An init file for gdb that adds a dashboard, which is printed whenever the program stops and can be hooked to print at other times too.
This is pretty great. It doesn't offer the easy point-and-click of a gui but it does reliably put a bunch of useful context on the screen. And it manages to do that without breaking or hiding basic features of gdb like most of the gui frontends I tried.
I'm still on the lookout for a good gui debugger, but this is what I'll use in the meantime.
voltron
Loris Cro suggested voltron which is similar to gdb-dashboard but opens the various view in separate terminals and updates them in real time. This seems like a strict improvement and I really like the idea.
After wading through the usual python dependency management morass, I managed to occasionally run some voltron views but mostly managed to crash it repeatedly, and occasionally gdb too.
(The gdb crashes are in somewhere inside printf so this might be the same issue as the tui crash above.)
gdb-frontend
Ilmari Lauhakangas suggested the somewhat generically named gdb-frontend.
If I type the full path in the file picker it pops up "An error has occurred". You have to type the dirname and then pick the file from the list.
When I ran the program it reached the breakpoint and then the UI stopped responding to button clicks and occasionally spat out messages saying the gdb main thread was blocking.
After C-c in terminal it left behind a bunch of ophan gdb processes that prevented gdbfrontend from being restarted.
ddd (again)
drosan explained that in ddd the focus follows the mouse which explains why I had trouble typing in the text boxes.
The other bugs I experienced are still blockers though.
related
Other tools that came up in the conversation:
gef and pwndbg add a bunch of commands to gdb that are useful for low-level debugging and reverse engineering. radare2 is an independent set of tools for the same purpose that can optionally connect to gdb. I don't have much use for these at the moment, but it's good to know about them.
codeclap looks interesting but is still in alpha and doesn't have a demo.
pernosco is a project I've been keeping an eye on. It's not currently affordable for hobby stuff, but I can certainly imagine paying for it when I start doing commercial work again.
frida injects javascript code into binaries. At the very least, this enables post-hoc println debugging. I've put aside a weekend in my calendar to try it out.
blinkenlights I think is a way to watch your code execute as directly as possible, so you can build intuition for what is actually happening on the hardware. I tried it out quickly and it rendered a single frame before exiting with code 0. EDIT Several months later I'm unable to reproduce this behaviour, but blinkenlights isn't yet complete enough to succesfully emulate any of the programs I've tried. I'll try again next year.
I haven't tried many proprietary options so far. While I have a strong preference for foss tools, I'm open to suggestions for good proprietary tools so long as I can try them out without emailing a sales team for a quote.